|
A series of briefs on New York population dynamics from the Cornell Program in Applied Demographics (PAD) at the Cornell Population Center
|
|
|
Housing Affordability in New York State
Cost has been a longstanding barrier to securing housing in the United States. Inequalities in income and wealth contribute to whether, and how easily, a household can afford to live in an area. Housing cost increases have outpaced changes in income, and with the additional rise in food and gas costs, household incomes face increasing pressure (JCHS 2022). Though both rent and home prices have sharply increased since the start of the COVID-19 pandemic (JCHS 2022), homeowners tend to have higher incomes and face lower levels of housing cost burden than renters (Office of the NYS Comptroller, 2019). However, the burden of housing costs on income varies by location. An area could be highly affordable for homeowners while simultaneously being unaffordable for renters. In this brief, we highlight nuances in affordability across tenure and geography in New York State.
|
|
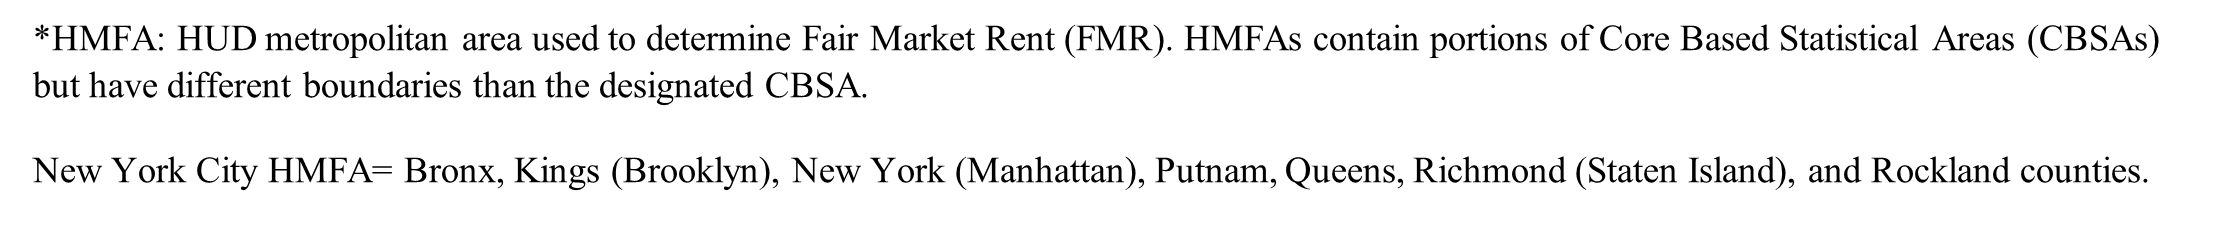
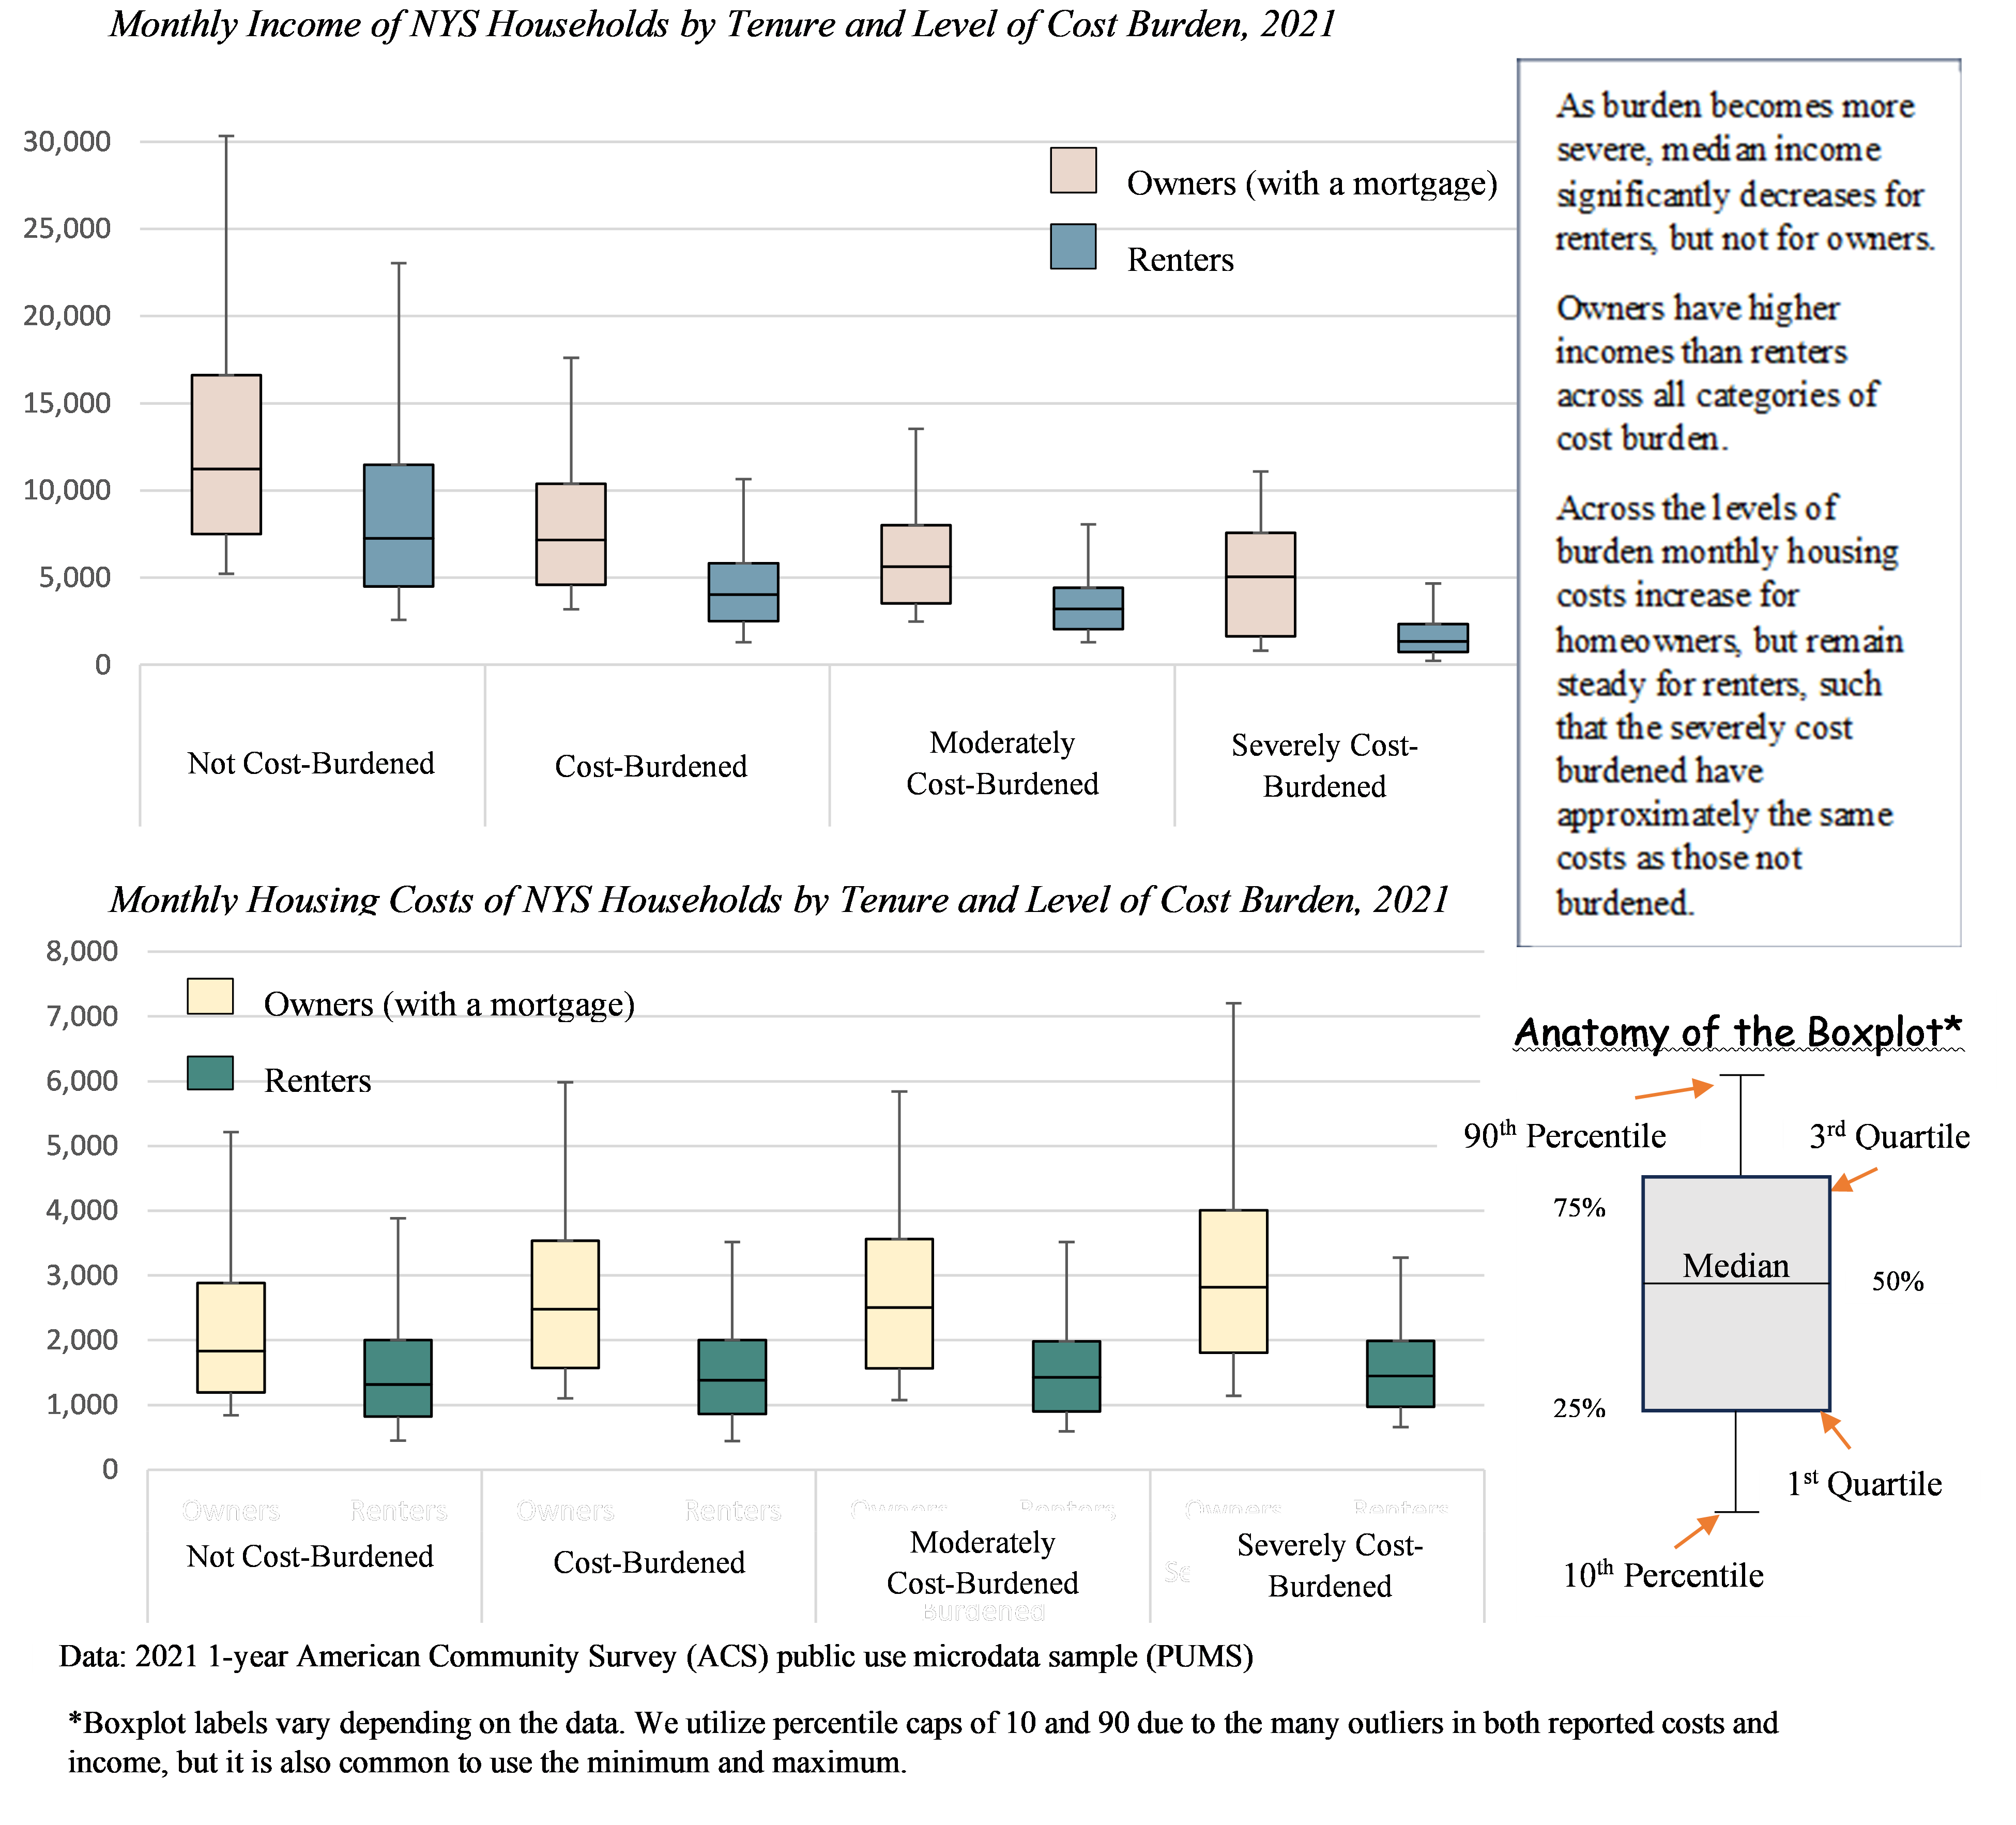
Data: Realtor.com Housing Inventory, retrieved from the Federal Reserve Bank of St. Louis (FRED) Database; 2021 1-year American Community Survey (ACS) PUMS and Housing Characteristics Data Profile.
|
|
|
The Affordability Problem: High costs, or low incomes?
|
|
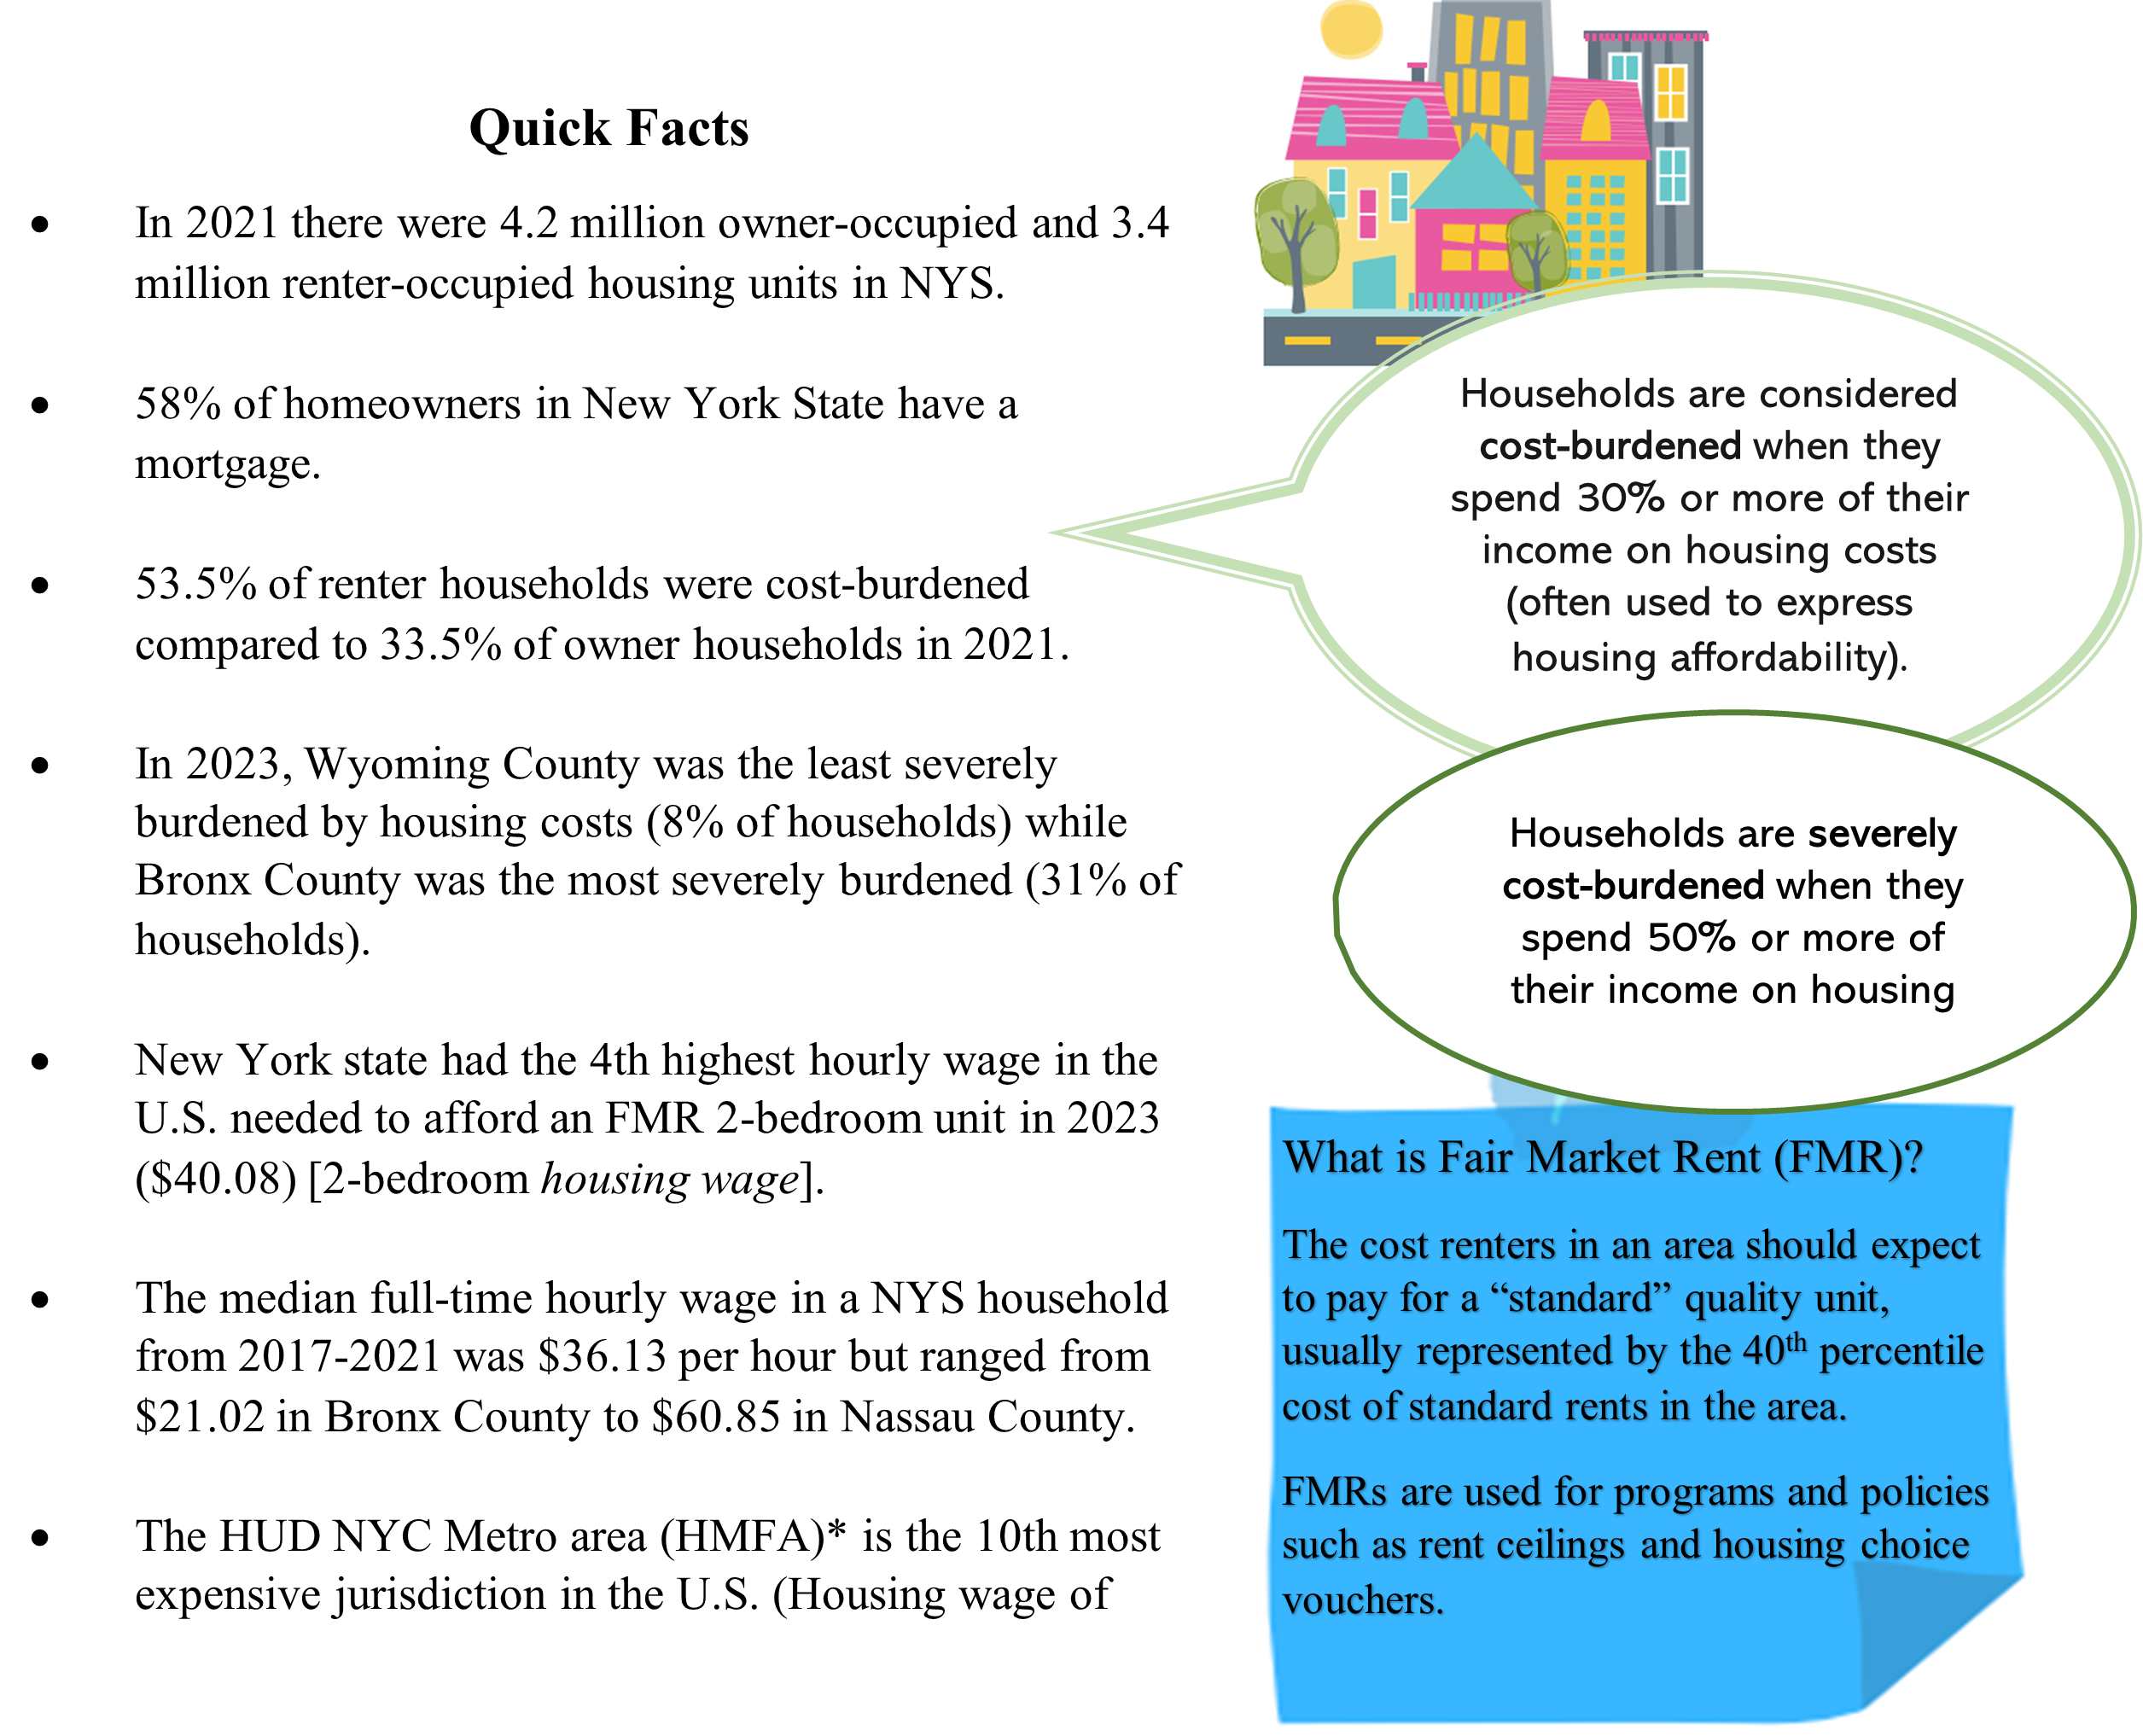
Affordability is often expressed as the share of income taken up by housing costs (such as in the table above). One complication of this measure is that the numerator or denominator could be driving the estimate, and therefore cost burden may not mean the same thing across households.
|
|
|
Area Matters!
Cost of living has a major impact on whether one’s income is sufficient to live somewhere comfortably. Average costs vary notably by area which influences purchasing power and therefore the affordability of that area.
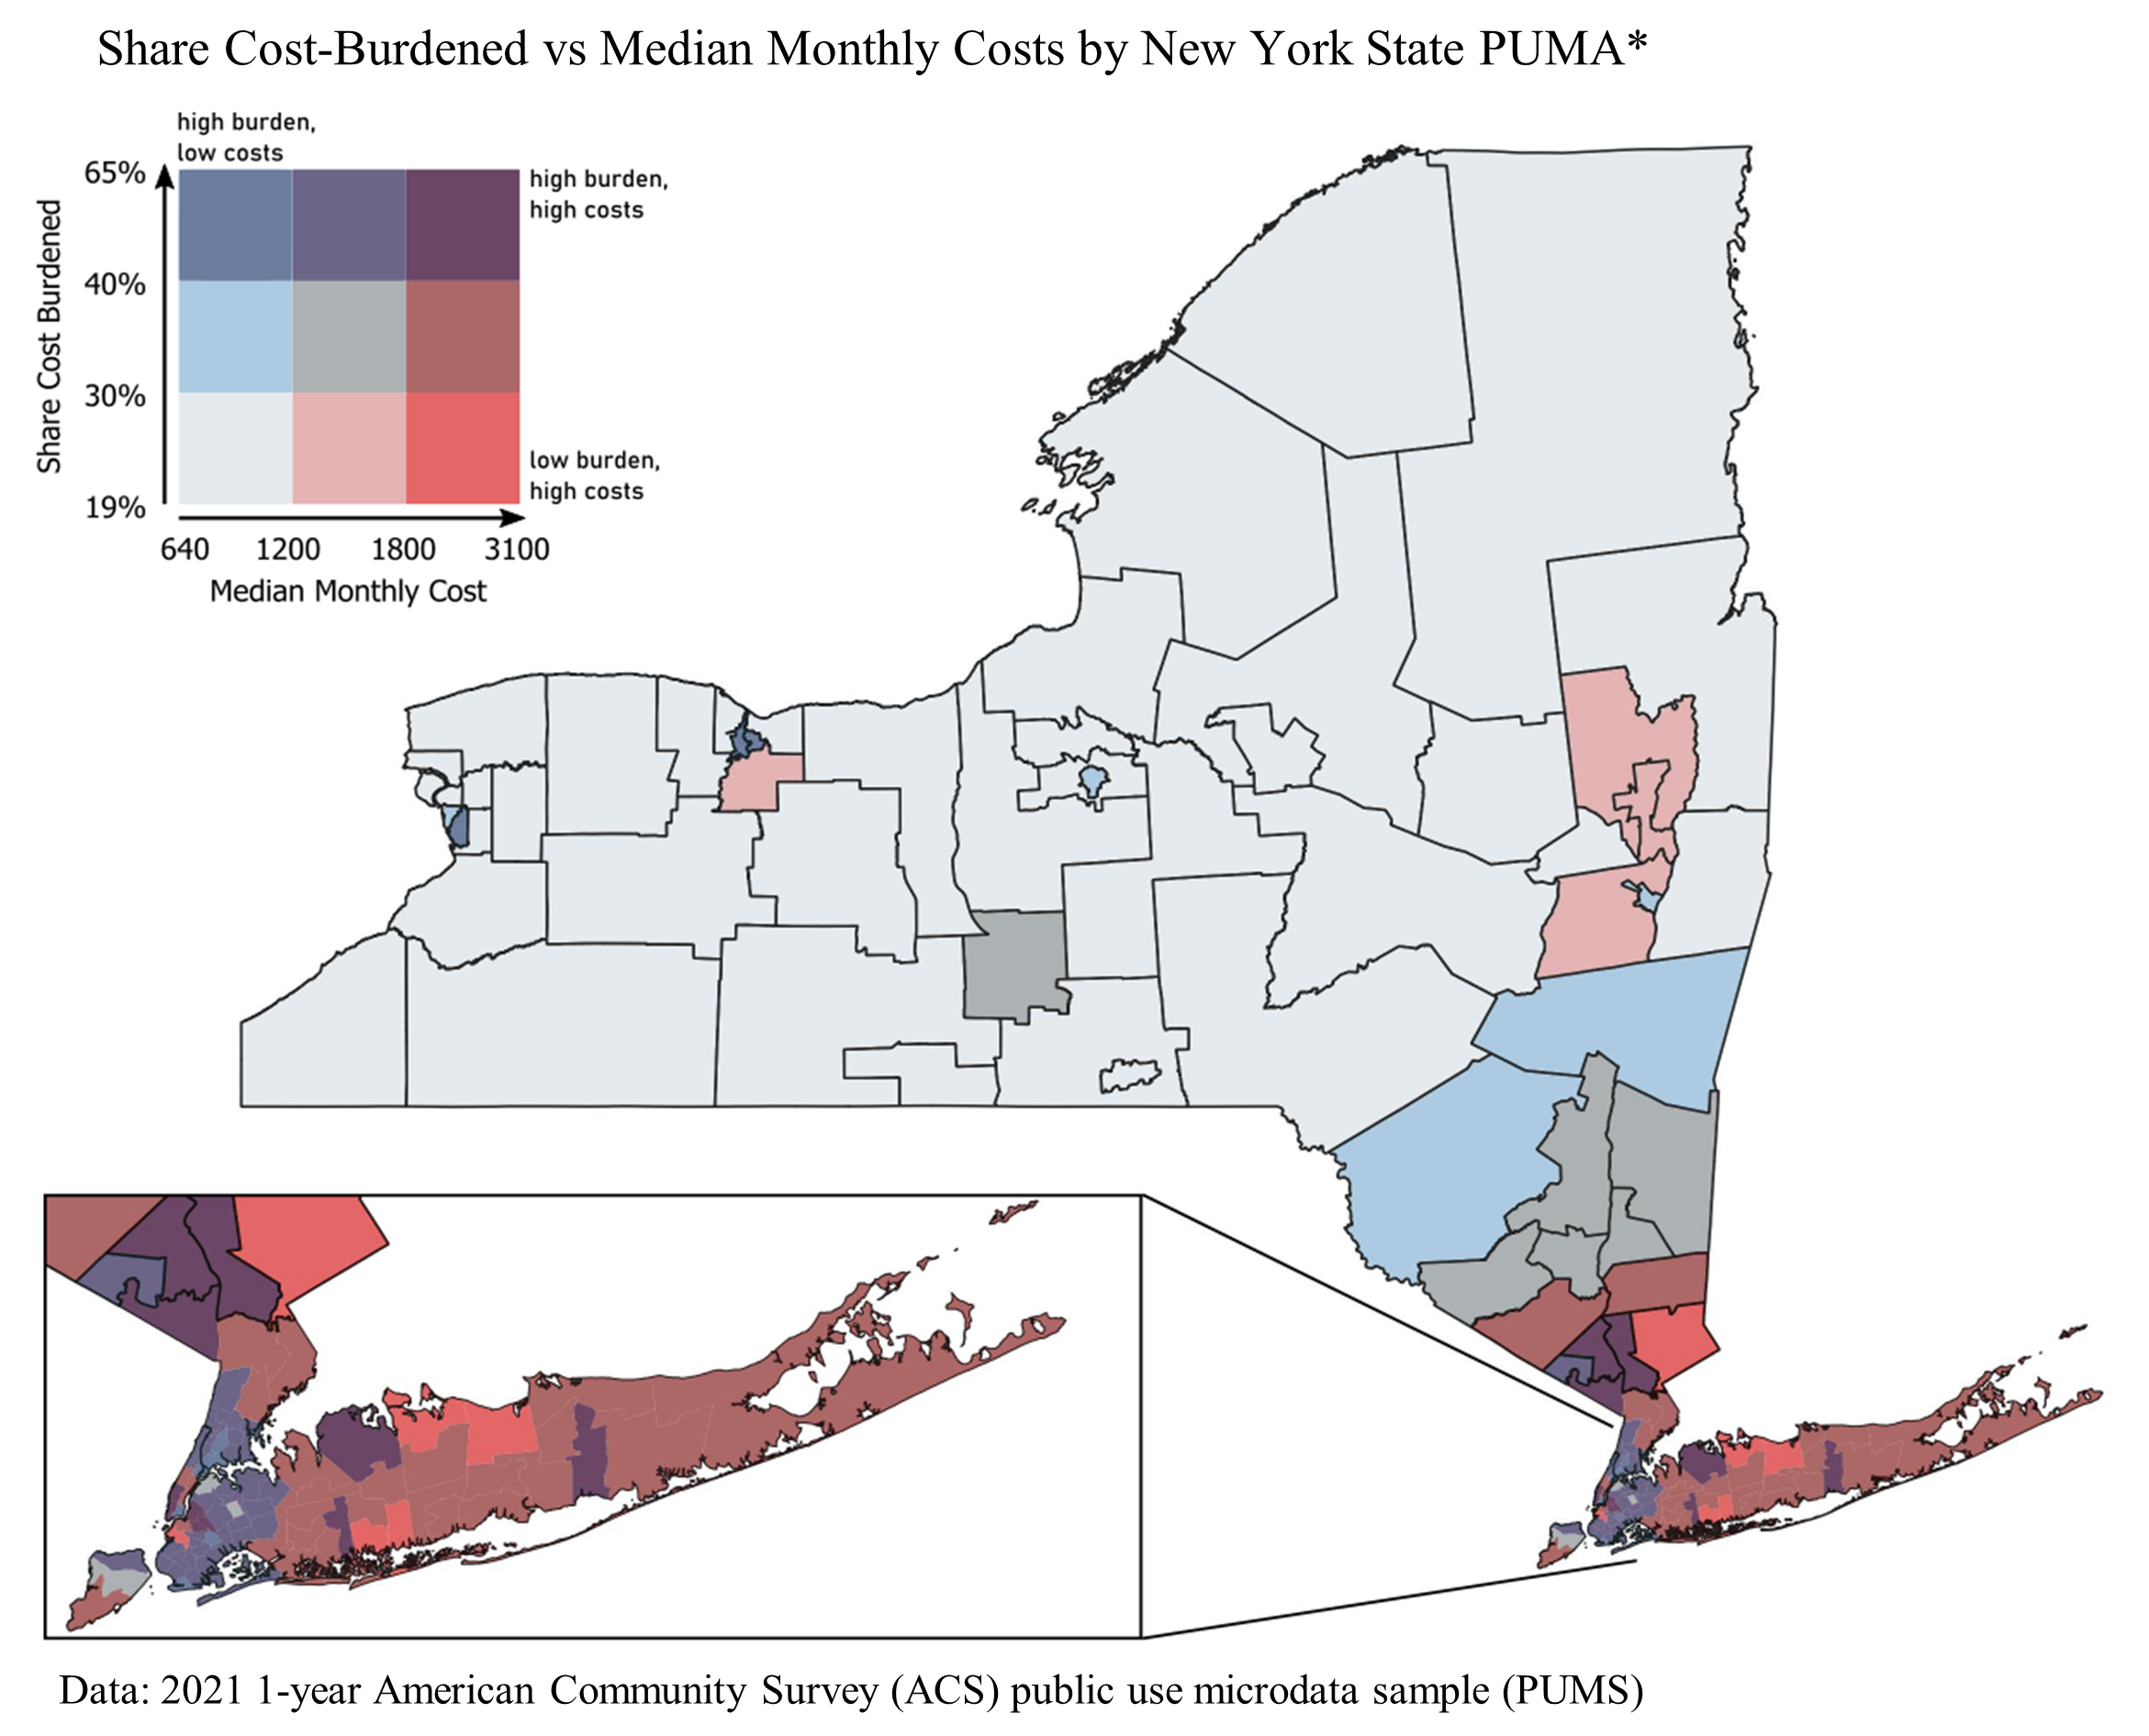
Most upstate PUMAs have low monthly costs and low shares of cost-burdened households. But, costs are higher in suburbs such as Fairport (southern Monroe County), while burden is higher within cities such as Buffalo (West: 37.7%, East:42.4%) and Rochester (West: 41.0%, East: 42.4%). Though both Buffalo and Rochester have high cost burden, their median monthly costs are low (< $1,200). Tompkins County is the only area outside of Downstate and the Hudson Valley to have both moderate monthly costs ($1,223) and level of cost-burden (32.9%).
Moving through Hudson Valley to downstate on the map above, average costs increase but burden only rises to 30-40% until reaching Rockland and Westchester, where there is more variation. There are many nuances in affordability throughout NYC and Long Island- for example, while South Oyster Bay Town and East-Central Hempstead Town (southeast Nassau County) have high costs but low cost-burden, the neighboring Meadowbrook Corridor of North Central Hempstead Town has both high costs and a large share of households that are cost-burdened (43.8%).
*Public use microdata areas (PUMs) are statistical geographic areas of 100,000 people or more. PUMAs are similar to counties, but since they are population-based there can be multiple PUMAs in a county, or multiple counties in a PUMA.
|
|
Data and Methods
To calculate median full-time hourly wage, annual median wage from the 2021 5-year ACS subject tables was divided by the typical number of hours worked per year for a standard full-time worker (52 weeks x 40 hours per week). For housing cost burden in and across New York State, we analyzed data on households (excluding group quarters) from the 2021 1-year ACS microdata (PUMS). Household income, monthly gross rent and owner costs were coded such that values less than or equal to zero were missing. This eliminated estimates of negative cost burden, results with an invalid denominator (zero), and false interpretation of “0” housing costs (an entry of 0 in owner costs and rent indicated N/A). Gross rent (monthly rental cost of a housing unit including utilities and fuel) is topcoded at 6,800 for New York State in the IPUMS 1-year ACS data (Ruggles et al., 2021). We calculated housing cost burden separately for households that were rented, and owned with a mortgage, as follows:

Burden was then classified into four categories: not cost-burdened (< 30%), cost-burdened (30-39%), moderately cost-burdened (40-49%), and severely cost-burdened (>50%). The share of each public use microdata area (PUMA) experiencing housing burden was defined as the number of households spending 30% or more of their income on housing costs, divided by the total household population in that PUMA.
|
|
References
FRED, Federal Reserve Bank of St. Louis, Realtor.com. 2023. Housing Inventory: Active Listing Count and Median Listing Prices in New York, [ACTLISCOUUS], retrieved from https://fred.stlouisfed.org/series/ACTLISCOUUS
Joint Center for Housing Studies of Harvard University (JCHS). 2022. “The State of the Nation’s Housing 2022”. https://www.jchs.harvard.edu/sites/default/files/reports/files/Harvard_JCHS_State_Nations_Housing_2022.pdf.
National Low-Income Housing Coalition (NLIHC). 2023. “Out of Reach (OOR): the High Cost of Housing”,
New York State Data. https://nlihc.org/oor/state/ny
Office of the New York State Comptroller, Thomas P. DiNapoli. 2019. “Housing Affordability in New York State”. https://www.osc.state.ny.us/files/reports/special-topics/pdf/housing-affordability-2019.pdf
Ruggles, Steven, Sarah Flood, Matthew Sobek, Danika Brockman, Grace Cooper, Stephanie Richards, and Megan Schouweiler. IPUMS USA: Version 13.0. American Community Survey (ACS) 2021 1-year estimates . Minneapolis, MN: IPUMS, 2023. https://doi.org/10.18128/D010.V13.0
U.S. Census Bureau, American Community Survey (ACS) 2021 1-year and 5-year estimates. Table S1901: Income in the Past 12 Months (in 2021 inflation-adjusted dollars).
|
|
|
|
|